
I built an internal invoicing tool to help expedite the invoicing process and increase the accuracy of digital invoices. Before this tool was created, all invoices were created manually. Line items from an Excel file had to be manually aggregated and summed before being typed into an invoice template. This process took a lot of time, and the manual approach led to occasional calculation errors or typos.
The primary goal of the tool was to process data from that existing Excel file. That file would remain the primary accounting tool / data store after this script’s creation, so no database design was necessary. The final invoicing Python script takes the line items from the Excel file, creates an invoice pdf, and drafts a billing email to the client, in a much faster and more reliable way.
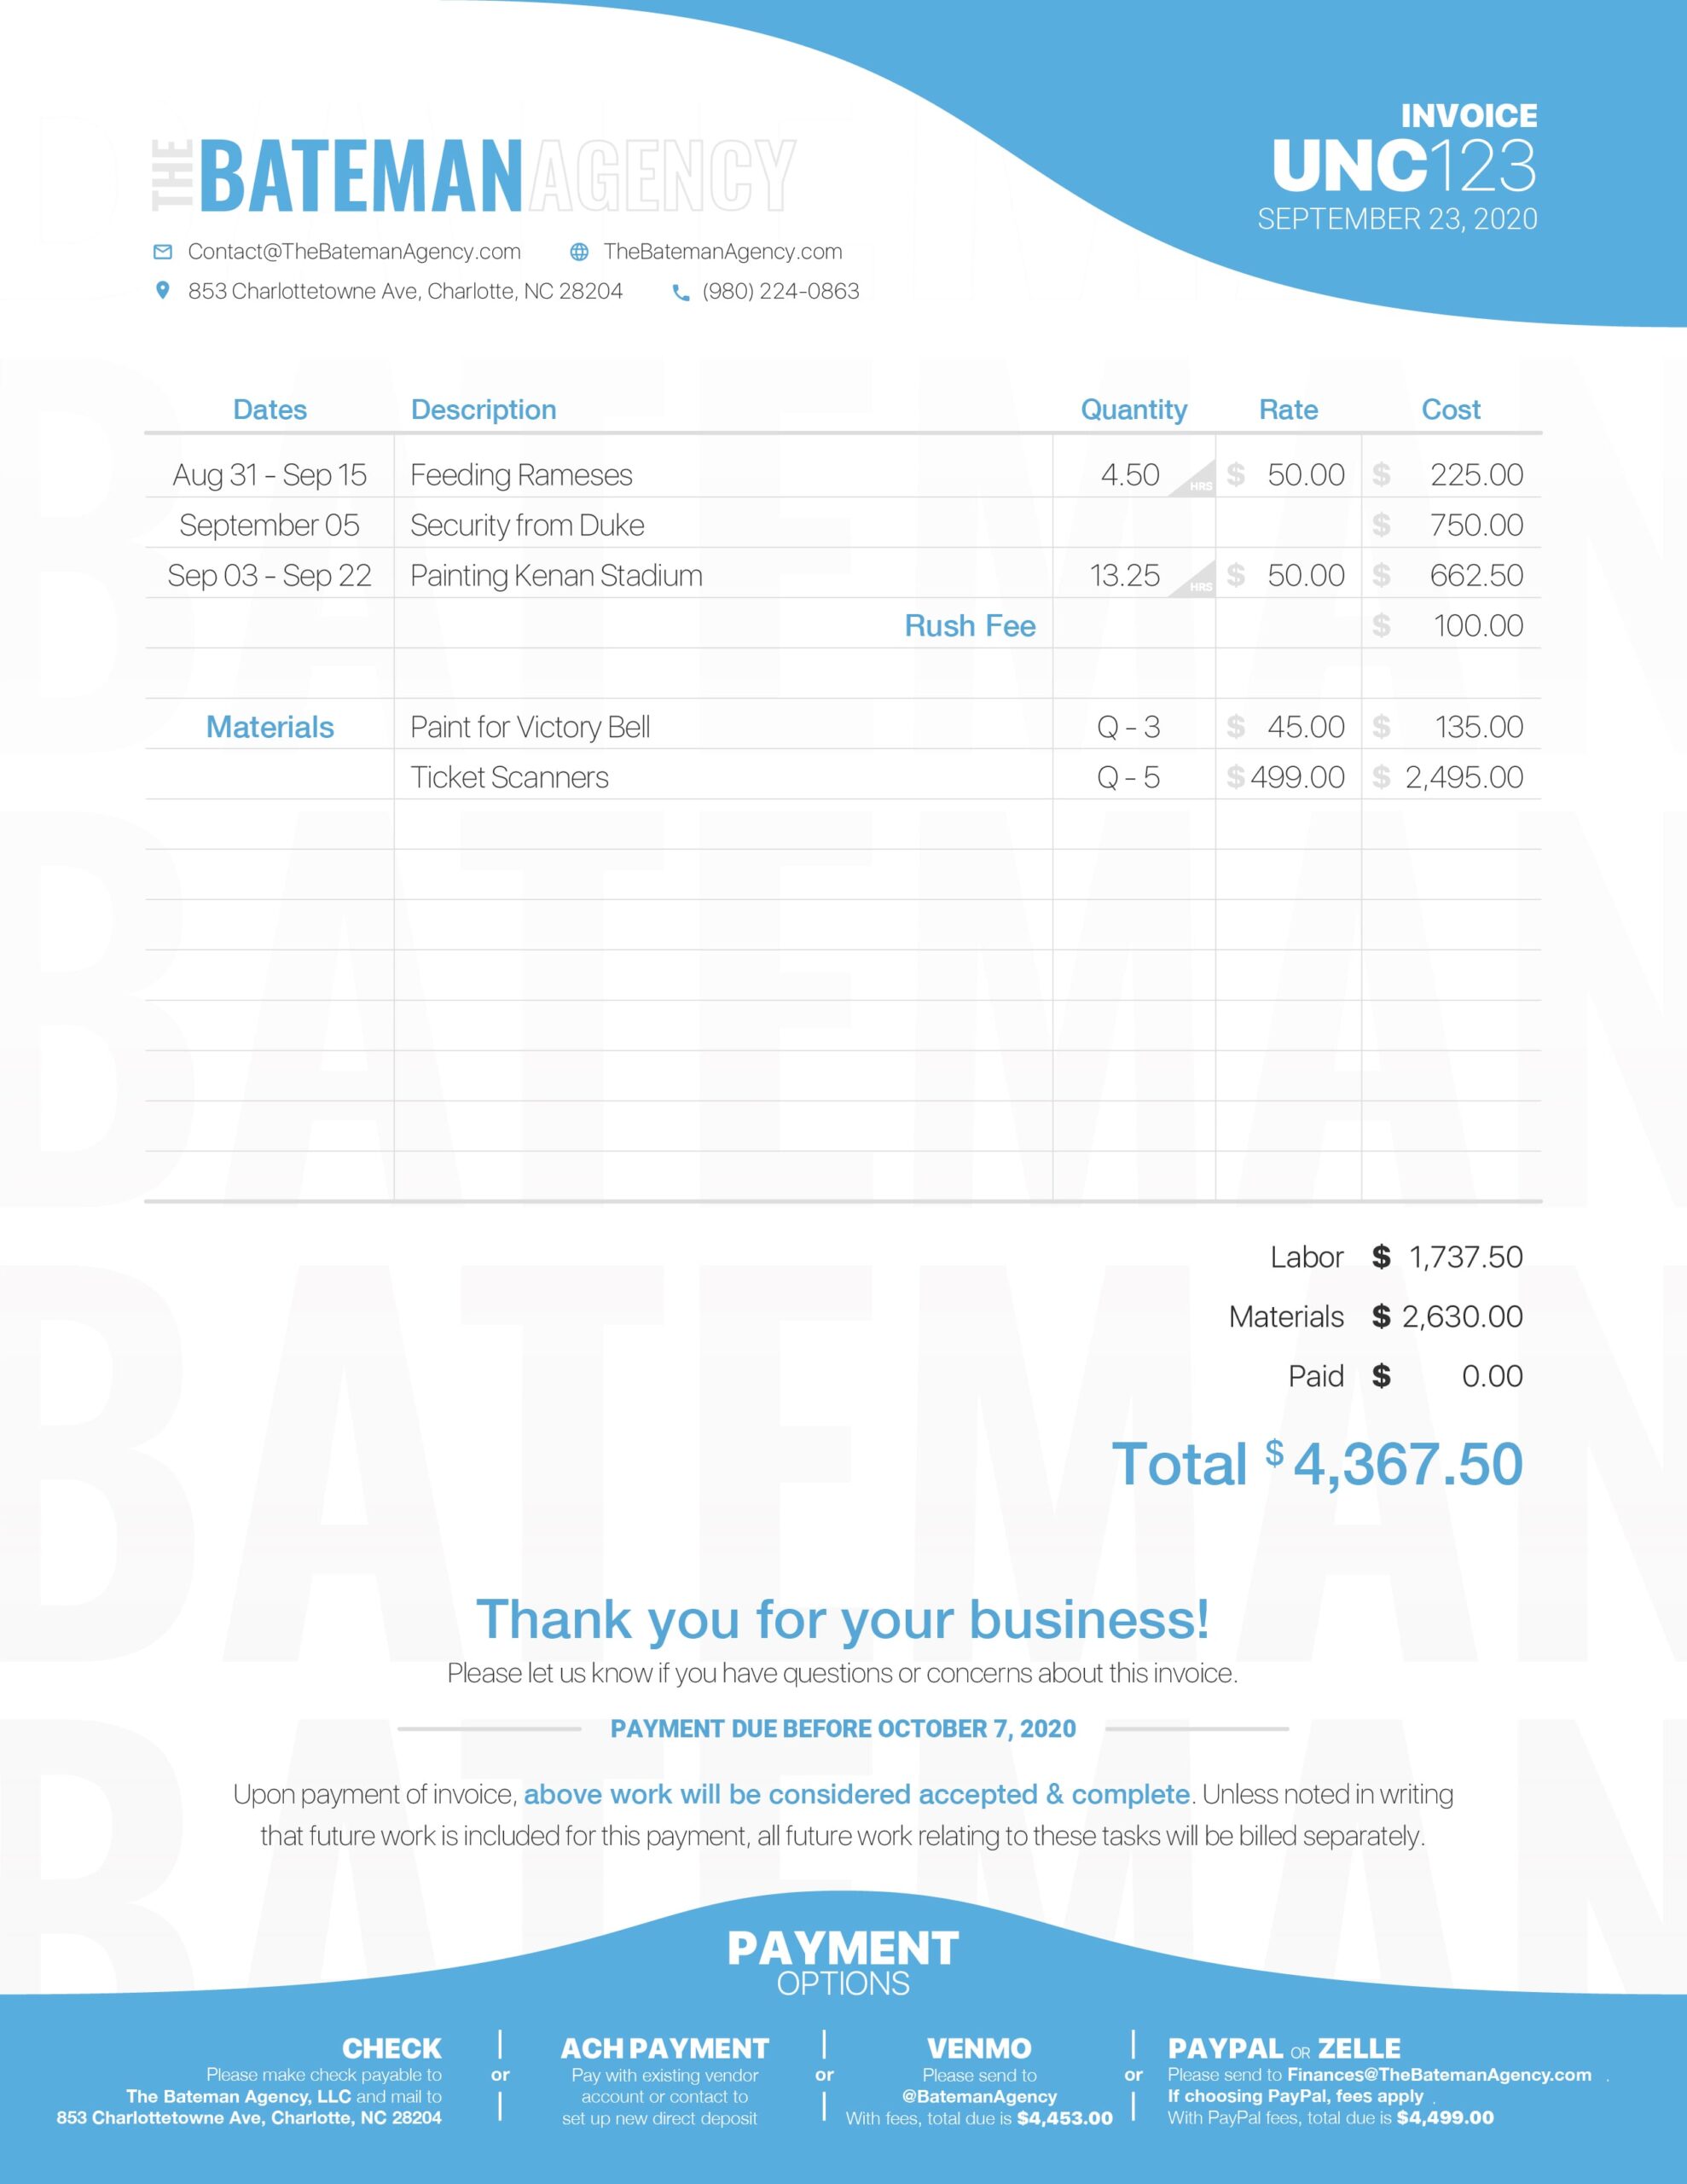
An example final invoice.
Data Processing
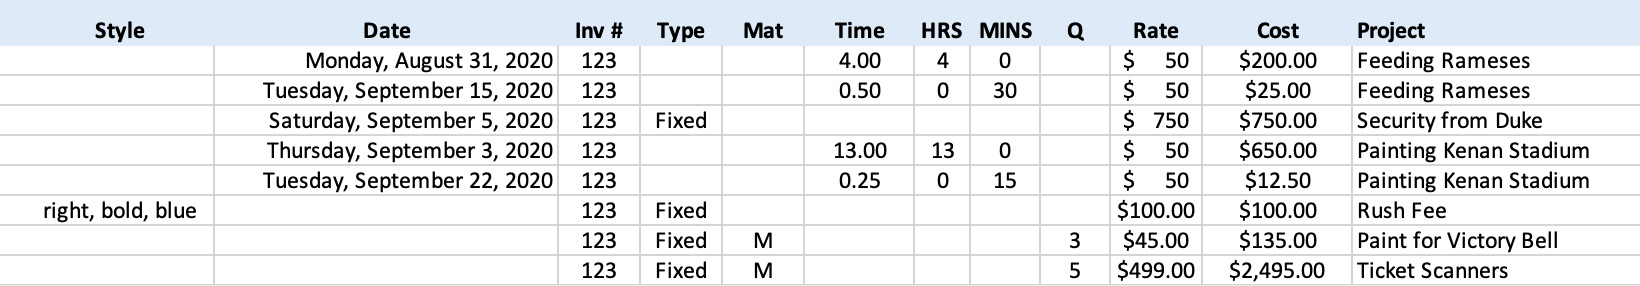
When a user runs the script, they first specify the client, invoice number, whether a due date should be shown, and whether to send a client email. The script first searches the Excel file for that client’s specific billing page by either finding a specific 3-letter code on the page or by the sheet’s name. It then creates a pandas DataFrame of all of the client’s line items before filtering the data down to line items with the argument invoice number.
After filtering the data, the script then splits the line items into materials and labor as specified by the Mat column. Labor is then aggregated by each project. This is done either by getting the total hours and hourly rate or by combining any fixed-price labor line items. The remaining material line items are similarly aggregated, collecting the total quantities and unit prices.
With all of the labor and materials summed, an Invoice object can be created. This object takes in the summed values of labor and materials, the start/end date for each labor line item, and any styling flags added in the Style column. This Invoice is this then passed to the pdf styler.
Invoice Generation
The PDF styler takes the Invoice data and lays it out in a pdf canvas using ReportLab. It first arranges a base background like the following.
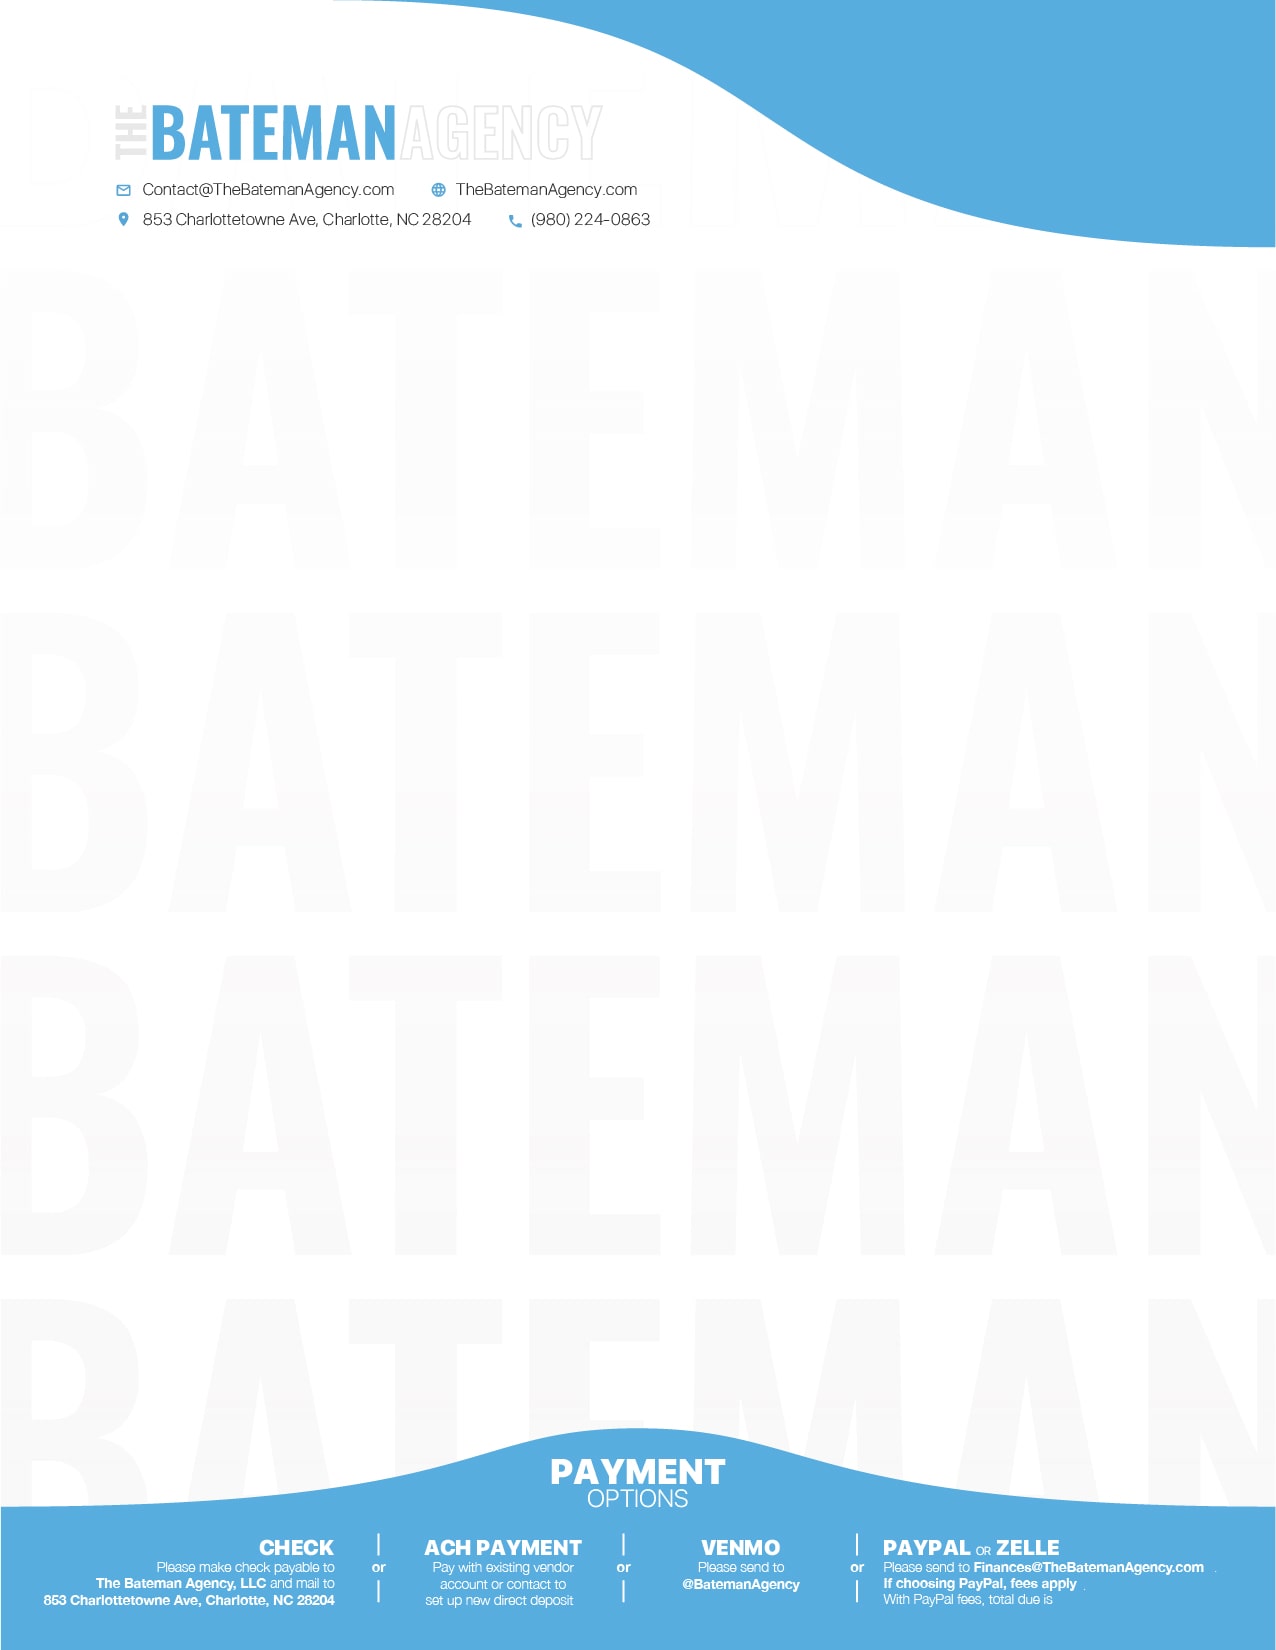
It then takes the client and invoice number the user first entered along with today’s date and creates the top right text like the image below.

The tool then creates the table of line items. This includes –
-
- Creating the base table grid and column headers. If more than 15 lines are required, additional rows are created.
- Creating the labor line items. This includes –
- calculating dynamic positioning for each row’s text and graphics
- formatting the dates differently for standalone dates versus date ranges
- changing formatting in certain rows as specified (ex – “Rush Fee” below specified right, bold, and blue)
- creating “HRS” corner graphic in Quantity column for hourly labor
- showing hourly rate if hourly
- showing overall line item cost for both hourly or fixed cost
- Creating the material line items.
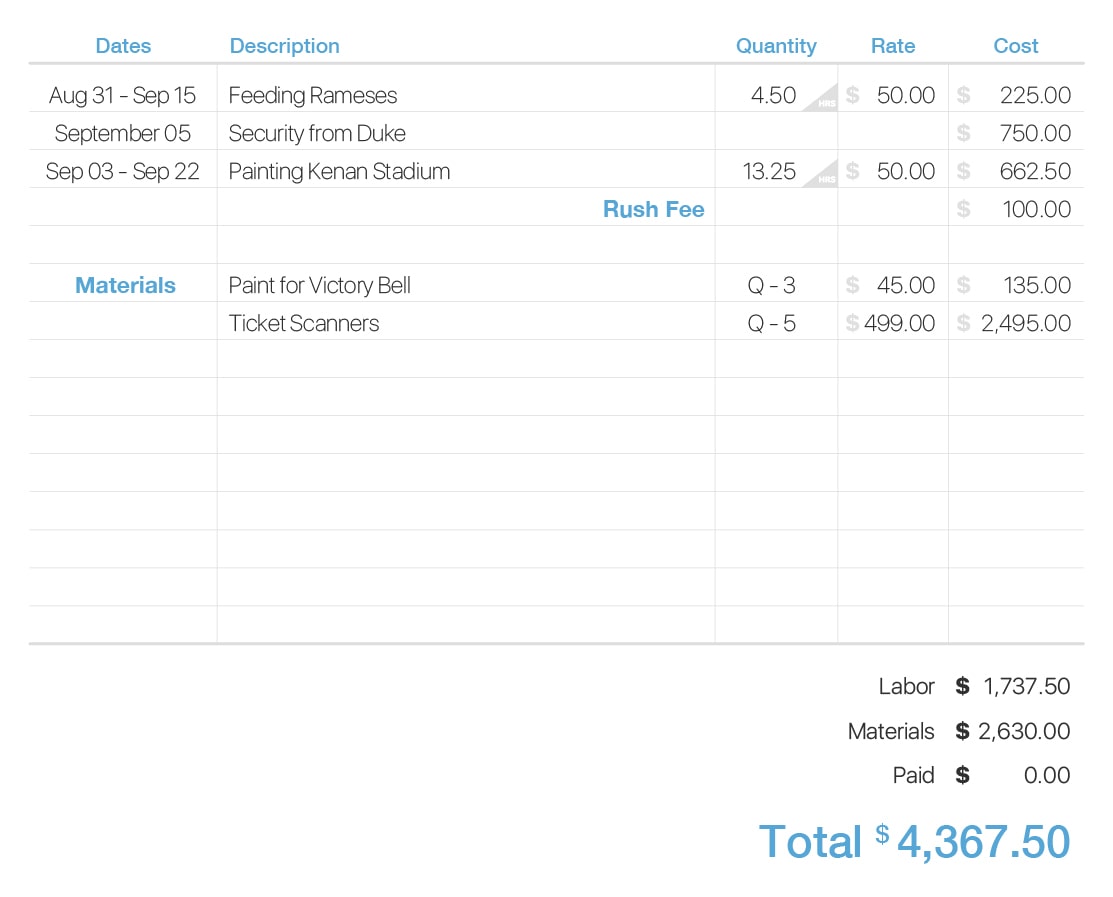
After creating the table, the overall totals are formatted and right-aligned below the table. Combining the two looks like the image below.
The script then evaluates whether the user originally specified to display the due date or not. It creates the appropriate variant of the next graphic as shown below.

Variant with due date shown.

Variant with due date not shown.
In the final pdf layout step, the text at the bottom is laid out. This includes totals from the Invoice object that calculate various fees that may be passed on to the customer. The pdf is then saved to a specific location. And if the user specified to email the client, the local email client is opened with the client’s email already filled in along with an appropriate subject, body, and the file window opened next to it to attach the pdf.